2017 Justice Gap Report
The phrase “with liberty and justice for all” in the U.S. Pledge of Allegiance represents the idea that justice should be accessible to everyone. In criminal cases, legal assistance is a right. However, there is no right to counsel in civil matters, and most low-income Americans are forced to go it alone without legal representation.
This report shows:
- In the past year, 86% of the civil legal problems reported by low-income Americans received inadequate or no legal help.
- 71% of low-income households experienced at least one civil legal problem in the last year, including problems with health care, housing conditions, disability access, veterans’ benefits, and domestic violence.
- In 2017, low-income Americans will approach LSC-funded legal aid organizations for support with an estimated 1.7 million problems. They will receive only limited or no legal help for more than half of these problems due to a lack of resources.
 Executive Summary
The Legal Services Corporation (LSC) contracted with NORC at the University of Chicago to help measure the justice gap among low-income Americans in 2017. LSC defines the justice gap as the difference between the civil legal needs of low-income Americans and the resources available to meet those needs. NORC conducted a survey of approximately 2,000 adults living in households at or below 125% of the Federal Poverty Level (FPL) using its nationally representative, probability-based AmeriSpeak® Panel. This report presents findings based on this survey and additional data LSC collected from the legal aid organizations it funds.
Click here to view the Executive Summary of the Justice Gap Report.
The 2017 Justice Gap Report
The phrase “with liberty and justice for all” in the U.S. Pledge of Allegiance represents the idea that everyone should have access to justice, not just those who can afford legal representation. In criminal cases, legal assistance is a right. Americans accused of a crime are appointed legal counsel if they cannot afford it. As a general matter, however, there is no right to counsel in civil matters. As a result, many low-income Americans “go it alone” without legal representation in disputes where they risk losing their job, their livelihood, their home, or their children, or seek a restraining order against an abuser.
This “justice gap” – the difference between the civil legal needs of low-income Americans and the resources available to meet those needs – has stretched into a gulf.1 State courts across the country are overwhelmed with unrepresented litigants. In 2015, for example, an estimated 1.8 million people appeared in the New York State courts without a lawyer.2 And we know that 98% of tenants in eviction cases and 95% of parents in child support cases were unrepresented in these courts in 2013.3 Comparable numbers can be found in courts across the United States.
This study explores the extent of the justice gap in 2017, describing the volume of civil legal needs faced by low-income Americans, assessing the extent to which they seek and receive help, and measuring the size of the gap between their civil legal needs and the resources available to address these needs.
Click here to view the Justice Gap Report, or scroll down to view the plain-text version.
Background
The Legal Services Corporation (LSC) was created by Congress in 1974 with the mission to expand access to the civil justice system for low-income Americans. LSC supports civil legal aid organizations across the country, which in turn provide legal assistance to low-income Americans grappling with civil legal issues relating to essential human needs, such as safe housing and work environments, access to health care, safeguards against financial exploitation, and assistance with family issues such as protection from abusive relationships, child support, and custody.
In 2005 and 2009, LSC published studies measuring the justice gap.4 Both were consistent in finding that about 50% of people who approached LSC-funded legal aid organizations for help did not receive help because of insufficient resources. The 2009 Report, Documenting the Justice Gap in America, also found that many courts were seeing increased numbers of unrepresented litigants.
LSC’s two previous reports on the justice gap used three approaches to describe the gap:
-
An intake census – a count of people seeking assistance from LSC grantees who were not served because of a lack of resources;
-
A review of state-level studies about access to civil justice and about unrepresented litigants in state and local courts; and
-
A comparison of the ratio of legal aid attorneys per capita for low-income Americans with the ratio of all private attorneys per capita for all Americans.
In addition to the 2017 Justice Gap Measurement Survey and LSC’s 2017 Intake Census, this report uses data from the U.S. Census Bureau’s American Community Survey (ACS). More information about the ACS data used can be found in Appendix B1. Finally, this report uses data from LSC’s 2016 Grantee Activity Reports, and more information about these data can be found in Appendix B4. Where the report relies on other data sources, this is referenced in endnotes as appropriate.
The 2017 Justice Gap Measurement Survey
LSC contracted with NORC at the University of Chicago to conduct a survey of more than 2,000 adults living in low-income households using its nationally representative, probability-based AmeriSpeak® Panel. For the purposes of the survey, “low-income households” are households at or below 125% of the Federal Poverty Level (FPL), the income eligibility standard for people seeking assistance from an LSC-funded legal aid program. The survey was administered using telephone and web interview modes, which allowed a flexible survey logic to gather detailed information about low-income Americans’ civil legal needs at the individual level, household level, and level of specific civil legal problems.
The survey was designed to accomplish the following goals:
-
Measure the prevalence of civil legal problems in low-income households in the past 12 months;
-
Assess the degree to which individuals with civil legal problems sought help for those problems;
-
Describe the types and sources of help that low-income individuals sought for their civil legal problems;
-
Evaluate low-income Americans’ attitudes and perceptions about the fairness and efficacy of the civil legal system; and
-
Permit analysis of how experiences with civil legal issues, help-seeking behavior, and perceptions vary with demographic characteristics.
This report uses data from the 2017 Justice Gap Measurement Survey to provide insight into the extent of the justice gap in 2017. It does not present or discuss all of the findings from the survey. Readers are encouraged to see the accompanying survey report that presents results from the entire 2017 Justice Gap Measurement Survey. Additionally, the survey instrument and data will be made publicly available.
More details on the survey and the AmeriSpeak® Panel can be found in Appendix A and also at www.lsc.gov/justicegap2017.
The units of analysis and the base sizes for the survey results presented throughout this report vary. Some results are based on respondents (or their households), some are based on their civil legal problems, and others are based on subsets of respondents, households, or problems. Readers are encouraged to pay close attention to information describing the units of analysis and which sets of observations comprise the relevant bases for results. Wherever a result is based on a variable containing a small number
of observations (n < 100), we indicate this with a special endnote, “SB-X” (where “SB” stands for “small base” and “X” corresponds to the endnote number in this series).
Report Overview
The core findings of this report are organized in four sections:
Section 1: Low-income America | Using current data from the U.S. Census Bureau and other sources, this section describes the low-income population in America. More specifically, it explores how many people live in households below 125% of
the Federal Poverty Level (FPL), how they are distributed across the U.S., and how key demographics like education and racial and ethnic background are distributed among them.
Section 2: Experience with Civil Legal Problems | Using data from the 2017 Justice Gap Measurement Survey, this section presents findings on the prevalence of civil legal problems among low-income households, the types of problems they face, and the degree to which civil legal problems affect their lives.
Section 3: Seeking Legal Help | Using data from the 2017 Justice Gap Measurement Survey, this section presents findings on which types of problems are most likely to receive legal attention, where people turn for legal help, what types of legal assistance they receive, and the reasons why people do not seek legal help.
Section 4: Reports from the Field | Using data from LSC’s 2017 Intake Census and 2016 Grantee Activity Reports, this section presents findings on the assistance low-income Americans receive after seeking help from a legal aid organization funded by LSC.
The report concludes with a “Special Focus” section. This section presents key findings for six groups that are highlighted throughout the report. These groups include seniors, persons with disabilities, veterans, parents and guardians of minor children, rural residents, and survivors of domestic violence or sexual assault. At the end of Sections 1, 2, and 3, we include a page that presents related findings for these groups.8 The findings for these highlighted groups are then summarized in this final “Special Focus” section of the report.
Client stories are presented throughout the report. These are meant to help readers understand the types of problems faced by low-income Americans. The stories were collected by LSC, primarily through searches of grantees’ annual reports and websites, but also through specific requests to grantees for such stories. These stories were first edited by LSC’s Government Relations and Public Affairs unit and vetted by the corresponding grantees for accuracy. NORC later completed additional minor edits to the stories in an effort to shorten them for inclusion in this report. In this report, the names have been changed to protect the identity of individuals. Likewise, the accompanying photos are not of the actual clients.
Study Findings in Brief
The findings presented in this report add important, new insights to the growing body of literature on the justice gap. We find that seven of every 10 low-income households have experienced at least one civil legal problem in the past year. A full 70% of low-income Americans with civil legal problems reported that at least one of their problems affected them very much or severely. They seek legal help, however, for only 20% of their civil legal problems. Many who do not seek legal help report concerns about the cost of such help, not being sure if their issues are legal in nature, and not knowing where to look for help.
In 2017, low-income Americans will approach LSC-funded legal aid organizations for help with an estimated 1.7 million civil legal problems. They will receive legal help of some kind for 59% of these problems, but are expected to receive enough help to fully address their legal needs for only 28% to 38% of them. More than half (53% to 70%) of the problems that low-income Americans bring to LSC grantees will receive limited legal help or no legal help at all because of a lack of resources to serve them.
Based on the analysis presented in this report, we have three key findings relating to the magnitude of the justice gap in 2017:
- Eighty-six percent of the civil legal problems faced by low-income Americans in a given year receive inadequate or no legal help (see Section 3);
- Of the estimated 1.7 million civil legal problems for which low-income Americans seek LSC-funded legal aid, 1.0 to 1.2 million (62% to 72%) receive inadequate or no legal assistance (see Section 4),9
- In 2017, low-income Americans will likely not get their legal needs fully met for between 907,000 and 1.2 million civil legal problems that they bring to LSC-funded legal aid programs, due to limited resources among LSC grantees. This represents the vast majority (85% to 97%) of all of the problems receiving limited or no legal assistance from LSC grantees (see Section 4).
Low-income America
As a general rule, LSC funds may be used only to serve the legal needs of people with family incomes at or below 125% of the Federal Poverty Level.10 This section describes this population of Americans. It explores how many people have family incomes at this level, how they are distributed across the U.S., and some key demographics of this population.
About the Data
Most of the population estimates presented in this section come from the 2015 American Community Survey (ACS) Single Year Estimates.11 Note that the ACS reports on people with family incomes below 125% of the Federal Poverty Level rather than at or below this income level (which is how income eligibility for LSC-funded services is defined). Occasionally, other data sources are also used and are noted accordingly. The unit of analysis in this section is individuals.
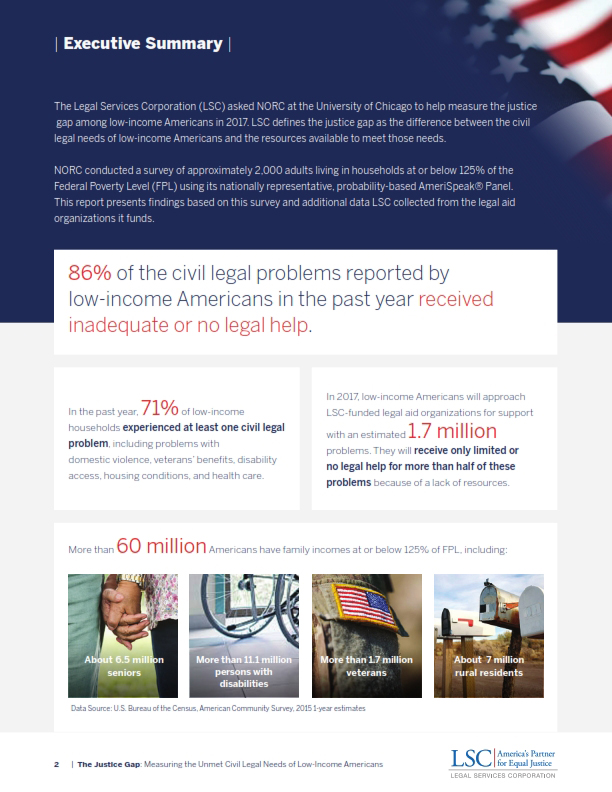
More than 60 million Americans have family incomes below 125% of the Federal Poverty Level.
A family income below 125% of the Federal Poverty Level (FPL) corresponds to $30,750 per year or less for a family of four.12 Based on recent estimates from the Census Bureau, nearly one in five Americans (19%) have family incomes below 125% of FPL. This comes to about 60 million people, including approximately 19 million children (0-17 years), 35 million adults aged 18-64 years old, and 6.4 million seniors (65+ years).13,14
As Figure 1 shows, some states have higher proportions of people with family incomes below 125% of FPL. The states with the highest proportions of people in low-income families include Mississippi (28%), New Mexico (26%), Arkansas (25%), and Louisiana (24%). Looking at population counts, a few other states stand out. For example, California alone has 7.7 million people with family incomes below 125% of FPL and Texas has 5.7 million people.15 Appendix B1 presents the population counts and proportions for all states in the U.S.
![Figure 1: Percentage of each state's population below 125% of the federal poverty level, 2015 [map of United States color-coded by poverty levels]](/sites/default/files/images/pg_17.png "Figure 1: Percentage of each state's population below 125% of the federal poverty level, 2015")
Client stories
Mary | Ohio | Health | Mary lives in an assisted-living community. When a health condition required rehabilitation, she entered a skilled nursing facility for what she expected would be a short-term stay. Once therapy was completed, however, the nursing home refused to begin discharge, insisting she required 24-hour care and demanding payment for her continued stay. Mary could not afford to pay for both the nursing home and her assisted living residence. Legal aid attorneys got involved, advocating for her right to make an informed decision about her living situation. They also helped Mary work with her primary care physician to arrange for the necessary home health services she needed to return to her home.
Most American adults with family incomes below 125% of FPL do not have any college education.
There is great disparity in education levels by income. About 62% of low-income Americans aged 25 years or older have no more than a high school education. Americans of the same age with higher family incomes are nearly three times more likely to have graduated from college (34% vs. 12%).17 Existing literature on the justice gap suggests that educational background is important for understanding access to justice.18
88% of low-income adults do not have a college degree, including 62% who have no more than a high school education.
While low-income Americans come from very diverse racial and ethnic backgrounds, a plurality identify as white (with no Hispanic origin).
Forty-four percent of Americans with family incomes below 125% of FPL identify themselves as white and claim no Hispanic origin. Another 28% identify as Hispanic, and 21% identify as black with no Hispanic origin. Four percent identify as Asian, 1% as American Indian, 8% as another race, and 4% as two or more races.19 The life experiences of people with different racial and ethnic backgrounds are thought to be important for understanding people’s likelihood to trust institutions and to seek civil legal assistance.20
| Special Focus | Millions of Americans from the various groups highlighted in this report have family incomes below 125% of FPL. This page presents population estimates for the number of low-income people for each group wherever such estimates are available. No such estimates are available for recent survivors of domestic violence or sexual assault, but we cite other information that speaks to rates of such violence among low-income Americans.
65+ Seniors: Approximately 6.4 million seniors have family incomes below 125% of FPL.21
Rural Residents: Approximately 10 million people living in rural areas of the U.S. have family incomes below 125% of FPL.22
Veterans: More than an estimated 1.7 million veterans have family incomes below 125% of FPL.23
Persons with Disabilities: More than 11.1 million people with a disability have family incomes below 125% of FPL.24
Parents/Guardians of Children under 18: Approximately 18 million families with related children under 18 have incomes below 125% FPL.25
Survivors of Domestic Violence/Sexual Assault: Rates of intimate partner violence among people with family incomes at or below 100% of FPL are about four times the rates among people with incomes at or above 400% of FPL.26
Experience with Civil Legal Problems
A large majority of low-income American households face civil legal problems in their everyday lives. These problems are most often related to basic needs like health care, safety, making ends meet, and housing. Using data from the 2017 Justice Gap Measurement Survey of low-income households, this chapter presents findings on the prevalence of civil legal problems among these households, the types of problems they face, and how civil legal problems affect their lives.
About the Data:
The findings presented in this section come from the 2017 Justice Gap Measurement Survey. Respondents were presented with an extensive list of specific problems that typically raise civil legal issues. They were asked whether they had experienced any of these problems in the past 12 months and whether anyone else in their household had. While not all of the reported problems would be able to be addressed through civil legal action, the resulting data make it possible to estimate how common various civil legal problems are at the household level. A total of 88 distinct problems (divided into 12 main categories) were explored in the survey. The primary unit of analysis in this section is households.
A large majority of low-income American households face civil legal problems.
The 2017 Justice Gap Measurement Survey assessed the prevalence of various types of problems that typically raise “justiciable civil legal issues,” that is, issues that could be addressed through civil legal action. This is consistent with standard practice in the literature for measuring the prevalence of civil legal problems. While an in-depth interview with a legal professional would reveal that some of the problems reported by respondents are not actually justiciable, most will be. For ease of reporting, and to be consistent with established literature, we refer to these problems as “civil legal problems” throughout this and the next section.
71% of low-income households have experienced at least one civil legal problem in the past year.
Seventy-one percent of low-income households have experienced at least one civil legal problem in the past year. Many of these households have had to deal with several issues. Indeed, more than half (54%) faced at least two civil legal problems and about one in four (24%) has faced six or more in the past year alone. The civil legal problems these Americans face are most often related to basic needs like getting access to health care, staying in their homes, and securing safe living conditions for their families.
Common civil legal problems among low-income households relate to issues of health, finances, rental housing, children and custody, education, income maintenance, and disability.
As Figure 2 shows, civil legal problems related to health and to consumer and finance issues affect more households than any other type of issue. Health issues, for example, affect more than two in five (41%) low-income households. The most common problems in this area include having trouble with debt collection for health procedures (affecting 17% of households), having health insurance that would not cover medically needed care or medications (17%), and being billed incorrectly for medical services (14%).
Over one-third (37%) of low-income households have experienced consumer and finance problems in the past year. These issues typically follow from not being able to make payments for debt or utilities on time. The most common issues in this area include difficulties with creditors or collection agencies (affecting 16% of households), having utilities disconnected due to nonpayment or a billing dispute (14%), and having problems buying or paying for a car, including repossession (8%).
Other common categories of civil legal problems include rental housing, children and custody, and education. Each of these problem categories affects more than one in four low-income households in which the issue is relevant (e.g., rental housing problems affect 29% of households living in a rented home). Income maintenance and disability issues affect one in five issue-relevant households.
Client Story
Ronald | Louisiana | Consumer and Finance | Ronald needed legal help when FEMA led a claim against him for repayment of disaster funds issued after Hurricane Katrina. He had never even applied for, much less received, any FEMA funds. FEMA seized his income tax refund and told him he had to pay an additional $8,000. With the help of legal aid, Ronald was able to demonstrate that the funds in question had been issued to someone else. FEMA dismissed the claim and returned the money wrongfully seized from Ronald’s accounts.
![Figure 2: Common civil legal problem categories. Percent of households experiencing at least one issue-related problem in the past year. Base sizes vary. [bar graph featuring percentage breakdowns]](/sites/default/files/images/pg_23.png "Figure 2")
Rental Housing | A full 29% of households living in a rented home have experienced a related civil legal problem in the past year. Such problems include having a landlord fail to provide basic services or repairs (affecting 16% of rental households), having a dispute with a landlord or public housing authority over rules or terms of a lease (11%), and living in unsafe rental housing (9%).
Children and Custody | Twenty-seven percent of households with parents or guardians of children under the age of 18 have experienced a civil legal problem related to children or custody in the past year. Related problems include difficulty collecting child support payments or setting up a child support obligation (affecting 13% of these households), being investigated by Child Protective Services (9%), and having trouble with custody or visitation arrangements (8%).
Education | Twenty-six percent of households with someone who is in school or someone who has a child in school have experienced at least one civil legal problem related to education in the past year. Problems in this area include being denied access to special education services or problems with access to learning accommodations (affecting 15% of these households), attending a school that was unsafe or had problems with bullying (9%), and being suspended from school (7%).
Disability | Twenty-three percent of low-income households where someone lives with disability report at least one civil legal problem related to disability in the past year. The most common problems are being denied state or federal disability benefits or services or having them reduced or terminated (affecting 14% of these households) and being denied or experiencing limited access to public programs, activities, or services because no reasonable accommodation was made (8%).
Income Maintenance | Twenty-two percent of low-income households have experienced at least one problem related to income maintenance in the past year. Related problems include not being approved for state government assistance or having that assistance reduced or terminated (affecting 15% of households), being denied or terminated from Social Security Disability income (SSDI) or Social Security Survivors benefit (6%), and being denied or terminated from Supplemental Security Income (SSI) (6%).
Other Types of Civil Legal Problems
Other areas where low-income Americans report civil legal problems include the following:
Employment. Civil legal problems related to employment affect 19% of all low-income households. Problems include being terminated from a job for unfair reasons (8%), having a workplace grievance not taken seriously or not adequately addressed (7%), and being exposed to working conditions that were physically unsafe or unhealthy (7%).
Family. Civil legal problems related to family affect 17% of all low-income households. Problems include experiencing domestic violence or sexual assault (8%), ling for divorce or legal separation (5%), and situations where a vulnerable adult has been taken advantage of or abused (4%).
Homeownership. Civil legal problems related to homeownership affect 14% of low-income homeowners. Problems include falling several payments behind on a mortgage (9%) and having a home go into foreclosure (5%).
Veterans’ Issues. Civil legal problems related to veterans’ issues affect 13% of low-income households with veterans or other military personnel. Problems include difficulty getting medical care for service-related health conditions (9%), being denied service-related benefits (8%), and problems with discharge status (4%).
Wills and Estates. Civil legal problems related to wills and estates affect 9% of all low-income households. Problems include needing help drawing up a legal document like a will or advance directive (7%) and needing help with probate or administering an estate, trust, or will (5%).
Civil legal problems affect people’s lives.
Civil legal problems can have a substantial impact on people’s lives. Many of the civil legal problems low-income Americans face relate to life-essential matters like losing a home, dealing with debt, or managing a health issue. There are also less direct, yet important, ways these problems affect people’s lives. For example, other research has shown that the stress of dealing with civil legal issues can lead to mental health conditions like anxiety and depression, which further complicate the situations of the families affected.29 Many civil legal problems, like having unsafe housing and losing benefits to buy food, can also pose a threat to physical health.
For each issue that respondents indicated they had personally experienced within the last 12 months, the survey asked them to rate the effect the problem had on them on a five-point scale from “not at all” to “severe.” Seventy percent of low-income Americans who personally experienced a civil legal problem in the past year, say at least one of the problems has affected them “very much” or “severely.” This amounts to more than half (55%) of all the problems personally experienced by low-income Americans. The types of problems most likely to have a substantial impact are those related to veterans’ issues (85%), SB-1 income maintenance (65%), employment (65%), rental housing (63%), and family (62%). See Figure 3 below.
![Figure 3: Civil legal problems substantially affecting people's lives. Percent of personally experienced problems affecting individuals "Very much" or "severely" [series of pie charts]](/sites/default/files/images/pg_26.png "Figure 3")
Client Story
Jill | Indiana | Housing | Jill, a senior and legal guardian of two young granddaughters, faced possible homelessness. Jill’s sole income came from Social Security Disability benefits, which qualified her for Section 8 subsidized housing. When Jill’s apartment was cited for not meeting Section 8 standards, the landlord refused to make the repairs, and the housing authority stopped its payments. The landlord filed an eviction notice for failure to pay rent despite Jill’s attempts to continue paying her portion of the rent. A legal aid attorney represented Jill in small claims court, and Jill and her two granddaughters were allowed to stay in the apartment while she searched for another suitable place to live. Without an eviction on her record, Jill retained her Section 8 eligibility and found a new, safe home for her granddaughters.
70% say at least one of their civil legal problems has “very much” or “severely” affected their lives.
Client Story
Misty | Nebraska | Income Maintenance | While giving birth to her third child, Misty, 32, went into cardiac arrest and was left with a serious heart condition that made her eligible for Social Security Disability benefits. She filed for benefits to help make ends meet and take care of her family, but was denied two times. With the help of legal aid attorneys, Misty’s third application for disability benefits was expedited and shortly thereafter, she received a favorable decision. The decision, which granted her $700 per month, also granted her Medicaid, which allowed her to secure a Ventricular Assist Device that has allowed her to live a more full life with her family again.
| Special Focus | Civil legal problems are common among the groups highlighted in this report, and many have experienced multiple problems. Households with survivors of domestic violence or sexual assault are particularly likely to experience civil legal problems. Ninety-seven percent have experienced at least one problem in addition to their problems related to violence. Additionally, compared to other households, households with survivors tend to face more problems in a year and are more likely to experience problems in most of the issue areas covered in the survey.
Seniors’ Households (n=286)
56% had at least 1 civil legal problem in past year
10% had 6+ problems in past year
Common problem areas: Health (33%), and Consumer /Finance (23%), and Income Maintenance (13%)
Households in Rural Areas (n=285)
75% had at least 1 civil legal problem in past year
23% had 6+ problems in past year
Common problem areas: Health (43%), Consumer/ Finance (40%), and Employment (25%)
Households with Veterans or Other Military Personnel (n=297)
71% had at least 1 civil legal problem in past year
21% had 6+ problems in past year
Common problem areas: Health (38%), Consumer/ Finance (36%), and Employment (20%)
Households with Persons with Disabilities (n=950)
80% had at least 1 civil legal problem in past year
32% had 6+ problems in past year
Common problem areas: Health (51%), Consumer/ Finance (44%), Income Maintenance (28%), and Disability (23%)
Households with Parents/Guardians of children under 18 (n=874)
80% had at least 1 civil legal problem in past year
35% had 6+ problems in past year
Common problem areas: Health (46%), Consumer/ Finance (45%), and Income Maintenance (28%), Custody (27%), Family (26%), Employment (26%), and Education (25%)
Households with Recent Survivors of Domestic Violence/Sexual Assault (DV/SA) (n=194)
97% had at least 1 civil legal problem in past year in addition to DV/SA 67% had 6+ problems
Common problem areas: Consumer/Finance (66%), Health (62%), Employment (46%), Rental Housing (45%), Income Maintenance (44%), and Family (40%) (in addition to DV/SA)
Seeking Legal Help
While most low-income Americans face at least one civil legal problem in a given year, only one in five seeks help from a legal professional. Using data from the 2017 Justice Gap Measurement Survey, this section presents findings on which types of problems are most likely to receive legal attention, where people turn for legal help, what types of legal assistance they receive, and reasons why so many people do not seek legal help. One noteworthy finding from this section is that 86% of the civil legal problems faced by low-income Americans in a given year receive inadequate or no legal help.
About the Data:
The findings presented in this section come from a section of the 2017 Justice Gap Measurement Survey that asked detailed questions about a subset of the civil legal problems reported by respondents. For each respondent, the survey randomly selected up to four personally-experienced problems affecting them more than “not at all.” Due to the low incidence of problems relating to veterans’ issues and disabilities, these problems were always selected if they met the other criteria. Respondents answered questions about what, if any, help they sought to address each of these problems. The unit of analysis in this section is problems.
Low-income Americans do not seek the help of legal professionals for most of their civil legal problems.
Low-income Americans report seeking the help of a legal professional for only 20% of their problems. Interestingly, people are only slightly more likely to seek professional legal help for problems that substantially affect them (24% of problems that affect them very much or severely) compared to problems that do not affect them much (17% of problems that affect them moderately or slightly).
Additionally, while we might expect to see differences in help-seeking behavior across education levels, low-income Americans with less education are only slightly less likely to seek professional legal help for their civil legal problems. Those with no more than a high school education seek professional legal help for 19% of their civil legal problems, and people with more education seek it for 22% of their civil legal problems. In fact, none of the differences observed by educational attainment are statistically significant.
Low-income Americans seek professional legal help for only 20% of the civil legal problems they face.
Low-income Americans get inadequate or no professional legal help for most of the civil legal problems they face.
Low-income Americans say they have received or expect to receive as much legal help as they need for 69% of the problems where they sought professional legal help. While this is a promising result, it is important to remember that they seek professional legal help for only 20% of their problems. Additionally, some respondents indicate that they tried to get professional legal help but were unable to do so.31 Taking all of this together, we find that low-income Americans receive inadequate or no professional legal help for 86% of their civil legal problems in a given year.32
Low-income Americans receive inadequate or no professional legal help for 86% of the civil legal problems they face in a given year.
People are more likely to seek professional legal help for problems that are more plainly "legal" in nature.
People are most likely to seek professional legal help for problems related to children and custodial issues and wills and estates. Low-income Americans seek such help for 48% of their civil legal problems related to children and custody and for 39% of their problems related to wills and estates.SB-3 Of all the civil legal problems explored in the survey, the ones in these categories are more obviously “legal.” Issues relating to children and child custody, for example, usually have to be decided or approved by a judge. Similarly, issues dealing with wills and estates involve legal paperwork and often lawyers as well.
While civil legal problems related to health issues and consumer and finance issues are the most commonly experienced problems among low-income Americans, they are not the problem areas most likely to get attention from a legal professional. As Figure 4 shows, people seek professional legal help for only 18% of their civil legal problems related to consumer and finance and for only 11% of those related to health.
![Figure 4: Civil legal problems for which professional legal help is sought. Percent of issue-related problems for which professional legal help is sought. Base sizes vary. [series of pie charts]](/sites/default/files/images/pg_31.png "Figure 4")
Low-income Americans who seek professional legal help rely on a variety of sources and most often receive help in the form of legal advice.
People who seek the help of a legal professional rely on various sources. They most often turn to legal aid organizations (30% of problems), paid private attorneys (29%), and social or human services organizations (24%). They go to volunteer attorneys 11% of the time and to disability service providers 10% of the time. Finally, low-income Americans reach out for help through legal hotlines for 8% of their civil legal problems.
As Figure 5 shows, when people get help from legal professionals, they are most likely to receive this help in the form of legal advice. Two in five (40%) problems receiving some sort of professional legal help are addressed with legal advice. People report receiving assistance filling out legal documents or forms for 21% of these problems, being represented by a legal professional in court for 20% of them, and getting help negotiating a legal case for 14% of them.
The legal services that people receive vary for at least two reasons. Of course, different types of problems require different types of help and to varying degrees. The help people receive also varies according to what resources might be available to help them address their specific civil legal needs. In the next section, discussion about the work of LSC grantees sheds light on how limited resources means that some cases receive more attention from legal aid professionals than others.
![Figure 5: Types of services received from legal professionals. [bar chart]](/sites/default/files/images/pg_32.png "Figure 5")
Client Story
Michaela | New Jersey | Veterans | Michaela is a lifelong New Jersey resident, always living there except for six years serving in the armed forces in the 1990s. While stationed in Alabama, she divorced, but a name change was not included in the divorce. As a result, when she returned to New Jersey after her service ended, she was compelled to obtain a driver’s license using her married name. Michaela used her maiden name in all other matters, causing issues in the various aspects of her life that involve identification (e.g., finances, utilities, leases, etc.). A legal aid attorney represented Michaela in a name change, permitting her to resume use of her maiden name and to once and for all clarify her identification in all aspects of her life.
When people do not seek professional legal help, they often turn to other resources.
Low-income Americans do not seek professional legal help for 78% of the civil legal problems they face in a given year. When someone does not seek such help, they turn to other resources about half of the time (for 54% of problems for which professional legal help is not sought). They speak with others who are not legal professionals (commonly friends and family members) for 33% of these problems, search for information online for 13% of these problems, or take both of these actions for 8% of these problems. When people search for information online, they often search for legal information about procedures to resolve a specific civil legal problem, legal rights on specific issues, or how to get legal assistance.35
Many people do not seek legal help because they think they can handle their problems on their own or because they do not know where to turn for help.
Combining the survey results on seeking professional legal help with those on searching for legal information online, we find that low-income Americans do not seek either type of legal help for 72% of the civil legal problems they face in a given year. Their reasons for not seeking either type of legal help or information are varied. See Figure 6. The most common reason is that they decide to deal with the problem on their own. This is cited 24% of the time. This is consistent with previous studies that find that many people are inclined to believe they can take care of their civil legal problems on their own.36 The next most common type of reason relates to not knowing where to look for help or what resources might be available. People cite this type of reason 22% of the time.
Not seeing their problem as a “legal” problem is another major barrier to seeking legal help.
We know from other studies related to the justice gap that a major reason people do not seek legal help is because they do not perceive their civil legal problems to be legal.37 We find that low-income Americans cite this reason for one in five (20%) civil legal problems where no legal help was sought. This is also consistent with the findings above showing that people are more likely to seek professional legal help for issues that are more plainly legal in nature like custody issues and wills, and less likely to do so for problems like health and finances, which are not as obviously legal.
Other reasons people give for not seeking legal help are being concerned about the cost of seeking such help (14%), not having time (13%), and being afraid to pursue legal action (12%). See Figure 6.
![Figure 6: Reasons for not seeking legal help [bar graph]](/sites/default/files/images/pg_34.png "Figure 6")
Views of the justice system do not seem to influence whether or not one seeks legal help.
The survey asked respondents the following three questions to assess their perceptions of the civil legal system:
- To what extent do you think people like you have the ability to use the courts to protect yourself and your family or to enforce your rights?
- To what extent do you think people like you are treated fairly in the civil legal system?
- To what extent do you think the civil legal system can help people like you solve important problems such as those you identified in this survey?
We compared people offering more positive views with those offering more negative views to see if there are any noteworthy differences in their patterns of seeking legal help. More specifically, we compared people to see if those holding certain perceptions would be more or less likely than others to seek legal help for at least one of their civil legal problems explored in depth in the survey. They are not. Low-income Americans who view the system in a more negative light are no more or less likely to seek professional legal help or to search for legal information online. See Figure 7.
![Figure 7: Seeking legal help by perceptions of the civil legal system [3 bar graphs]](/sites/default/files/images/pg_35.png "Figure 7")
| Special Focus | Rates of seeking professional legal help do not vary much across the groups highlighted in this report.40 All seek such help for only about one in five of their civil legal problems. For most, the two most common reasons for not seeking legal help are not knowing where to look and deciding to deal with the problem on their own. The only exception is recent survivors of domestic violence or sexual assault, who cite not being sure if a problem was a legal issue 31% of the time. Also noteworthy is that seniors are more likely than others to cite not having time as a reason for not seeking legal help.
Seniors (n=306 problems)
Seek professional legal help for 19% of problems
Top reasons for not seeking legal help: didn’t know where to look (22%), decided to deal with problem on own (21%), and didn’t have time (19%)
Rural Residents (n=558 problems)
Seek professional legal help for 22%of problems
Top reasons for not seeking legal help: decided to deal with problem on own (26%), wasn’t sure if legal (21%), and didn’t know where to look (18%)
Veterans (n=511 problems)
Seek professional legal help for 21% of problems
Top reasons for not seeking legal help: didn’t know where to look (29%), decided to deal with problem on own (25%), and wasn’t sure if legal (18%)
Persons with Disabilities (n=1986 problems)
Seek professional legal help for 20% of problems
Top reasons for not seeking legal help: decided to deal with problem on own (25%), didn’t know where to look (21%), and wasn’t sure if legal (19%)
Parents/Guardians of Children under 18
(n=1758 problems)
Seek professional legal help for 21% of problems
Top reasons for not seeking legal help: decided to deal with problem on own (25%), didn’t know where to look (21%), and wasn’t sure if legal (20%)
Survivors of Domestic Violence/Sexual Assault
(n=621 problems)
Seek professional legal help for 23% of problems
Top reasons for not seeking legal help: wasn’t sure if legal (31%), didn’t know where to look (23%), and decided to deal with problem on own (20%)
Reports from the Field
The previous section explored the demand side of the justice gap. This section explores the supply side. Using data from LSC’s 2017 Intake Census, this section presents findings on the assistance low-income Americans receive after seeking help from an LSC-funded legal aid organization. One key finding is that, given the number of low-income Americans who are expected to seek help in 2017, LSC grantees will not be able to provide adequate legal assistance for an estimated 1 million civil legal problems due to a lack of resources.
About the Data
Most of the findings in this section are based on analysis of the data collected during LSC’s 2017 Intake Census. For six weeks in March and April 2017, LSC grantees tracked the individuals who contacted them seeking assistance with civil legal problems. Individuals coming to LSC grantees with problems were grouped into three main categories: unable to serve, able to serve to some extent (but not fully), and able to serve fully.41 The resulting data permit estimates of the rates at which people seeking legal help for a problem from LSC-funded legal aid organizations receive the legal assistance necessary to meet their needs. The unit of analysis in this section is problems.42
More than half of the problems receiving legal case services from LSC-funded legal aid programs involve family and housing issues.
As a general rule, to be eligible for LSC-funded legal assistance, an individual must have a family income at or below 125% of the Federal Poverty Level (FPL), and their civil legal problem cannot be related to issues for which use of LSC funds is prohibited, like abortion, euthanasia or class-action litigation.43 We will refer to civil legal problems that meet these criteria as “eligible problems” or “eligible civil legal problems” throughout this section.
Not all income-eligible individuals with a legal problem receive the legal assistance they need. To maximize the use of available legal aid resources, LSC grantees develop guidelines on the types of legal problems they prioritize for service. LSC requires grantees to conduct comprehensive legal needs assessments in their communities on a regular basis to inform these guidelines. Some income-eligible individuals have problems that fall within these priority guidelines, but still do not receive the assistance they need for other reasons. We examine these instances throughout this section, trying to assess the extent to which they are shaped by a lack of resources.
The types of problems for which LSC grantees provided case services in 2016 are summarized in Figure 8.44 Family problems, including child custody, as well as housing problems like evictions and rental repairs, form the bulk of LSC grantees’ casework.
The reader will notice that the distribution across the problem categories reported by LSC grantees is different from the distribution of problems experienced by low-income Americans that was presented in Section 2 (see Figure 2). This is due in large part to the types of problems LSC grantees prioritize as well as the fact that people are more likely to seek legal help for certain types of problems, as was discussed in Section 3.
![Figure 8: Civil legal case services by problem category, 2016 [Bar graphs]](/sites/default/files/images/pg_39.png "Figure 8")
In 2017, low-income Americans are expected to approach LSC-funded legal aid organizations for help with more than 1.7 million civil legal problems.
During LSC’s six-week-long Intake Census, low-income Americans approached grantees for assistance to address nearly 196,000 eligible civil legal problems. Based on this, we project that low-income Americans will approach LSC grantees with an estimated 1.7 million eligible civil legal problems in 2017.
Our projection likely underestimates the number of eligible problems that will be brought to LSC grantees. While the vast majority (89%) of reporting grantees said their intake during this six-week period was typical in terms of the number and type of problems brought to them, 12 grantees reported they processed fewer problems than normal due to staff shortages, office closures, or other reasons. Three other grantees reported it was atypical in other ways, including one who says they experienced more traffic than usual. Additionally, one grantee (out of a 133 total grantees) did not report any data for the Intake Census and, thus, the problems they processed during the six-week period are not accounted for in the sample counts nor in the 12-month projections. Finally, LSC grantees counted individuals (not problems or case services) during the Intake Census, and it is possible that one person could seek assistance for more than one civil legal problem.
It is important to keep in mind that these estimated 1.7 million civil legal problems represent less than 6% of the total civil legal problems faced by low-income Americans. Recall from Section 3 that low-income Americans seek professional legal help for only 20% of their civil legal programs, and they turn to legal aid organizations for only 30% of the problems for which they seek such help. Taken together, this means they seek professional legal help from legal aid organizations 6% of the time. Note that this corresponds to help sought from the set of all legal aid organizations in the U.S., not just those funded by LSC.
Low-income Americans likely seek the help of legal aid organizations for even more problems that do not get processed for intake.
The estimated 1.7 million problems low-income Americans will bring to LSC grantees in 2017 is more accurately described as the number of problems that LSC grantees will process for intake in 2017. There are likely other problems that people consider bringing or try to bring to an LSC grantee, but are unable to get to or through the point of intake. These situations are not captured in the Intake Census data. It is difficult to know how often this happens, but because legal aid organizations can only offer intake for so many hours and in so many ways, it is bound to happen. The types and availability of various intake modes varies across LSC grantees, depending on the resources they have at their disposal (e.g., staffing, technology, and other resources).
There are three primary intake modes currently offered by LSC-funded legal aid organizations:
- In-person: This a face-to-face interview that takes place at the legal aid program’s office. This can happen on a walk-in basis or as the result of an appointment.
- Phone: This involves conducting the screening process over the phone. This often involves a mix of going through an automated process (e.g., “press two if you...”) and speaking with a legal aid staff member directly.
- Online: This method involves submitting interview information via an online form or web application.

Most legal aid organizations have set hours for intake, which are scheduled times when new requests for assistance are received. Intake hours can vary for a variety of reasons, including program resources and community needs. Online options are the exception; these screening tools are usually available continuously and monitored regularly by staff during business hours.
When grantees submitted their Intake Census data to LSC, they also indicated how many hours per week they offered various intake modes (on average). Figure 9 presents the percent of LSC grantees that offer various intake modes for at least 30 hours per week and that offer online intake. Sixty-five percent of grantees offer in-person intake on a walk-in basis for at least 30 hours per week; 53% offer in-person intake by appointment for at least 30 hours per week; and 55% offer intake by phone for at least 30 hours per week. About half (51%) of LSC grantees offer online modes of intake.
Client story
Donna | New York | Domestic Violence | Donna, a rural resident of New York State, suffered from severe mental health problems resulting from domestic violence and the sexual abuse of one of her children. She did not feel comfortable speaking about her situation before contacting an LSC grantee, who helped her address various civil legal problems she was facing. Specifically, the legal aid attorney helped Donna avoid a workfare sanction by the local Department of Social Services and won her SSI appeal, permanently removing her from the county welfare rolls. Donna received over $40,000 in retroactive SSI benefits, which has allowed her to establish her own home and provide a college education for her child.
Low-income Americans receive some kind of legal help for 59% of the eligible civil legal problems they bring to LSC-funded organizations.
In 2017, LSC grantees will provide some form of legal assistance for an estimated 999,600,
or 59%, of eligible problems presented by low-income Americans. The type and extent
of help vary, depending on the requirements and complexity of a given problem and the resources available. From the Intake Census data, we can group eligible problems for which LSC grantees provide assistance into three main categories: “fully served”; “served, but not fully”; and “served, but extent of service pending” (or, for short, “served, extent pending”). This information is summarized in Table 1 along with corresponding 12-month projections for 2017.
![Table 1: Distribution of eligible problems by extent of service [matrix]](/sites/default/files/images/pg_42.png "Table 1")
Problems fully served
LSC grantees reported they will be able to “fully serve” at least 28% of all the eligible problems low-income Americans presented during the intake census (see Table 1 above). In these instances, people receive legal assistance expected to fully address their legal needs. This can take the form of providing legal information or self-help resources (12% of fully-served problems) or of “limited services” like providing legal advice, speaking with third parties on behalf of a client, or helping to prepare legal documents (45% of fully- served problems).49 Another 43% of fully-served problems receive “extended service,” which includes cases in which a legal aid attorney represents a client in negotiated settlements (with or without litigation), in administrative agency hearings or other administrative processes, or in a court proceeding.50 See Figure 10.
Problems served, but not fully
Of all the eligible problems low-income Americans presented to LSC grantees during the intake census, at least 21% will receive some legal assistance, but not to the extent necessary to fully address the clients’ legal needs (see Table 1 above). Help for people with these “served, not fully” problems takes the form of providing legal information or self-help resources (36% of problems served, but not fully) and “limited service” like providing legal advice, speaking with third parties on behalf of a client, or help preparing legal documents (64% of problems served, but not fully).51 See Figure 10.

Problems served, but extent of service pending
At the conclusion of the Intake Census, LSC grantees had not yet determined the level of legal assistance for 10% of eligible problems presented to them.
After seeking legal assistance from LSC grantees, low-income Americans will not receive any legal assistance for an estimated 700,000 eligible problems in 2017.
Forty-one percent of the eligible problems low-income Americans presented to LSC grantees during the intake census will not receive any legal help from grantees. This corresponds to slightly more than an estimated 700,000 problems for 2017. There are many reasons why an individual with an eligible civil legal problem might not receive legal assistance. More than half (54%) of these problems are not served because they fall outside of the guidelines grantees use to prioritize eligible problems due to limited resources. About one in four (24%) eligible problems falls within grantees’ priorities, but is not served due to insufficient resources. A small portion (6%) are not served because the grantee has identified a conflict of interest. For example, the organization might already be representing another party to the dispute. Finally, 16% do not receive legal assistance for other reasons, often involving situations where contact with a client is lost.
Low-income Americans will receive insufficient or no legal help for an estimated 1.1 million eligible problems this year alone.
Estimating the number of eligible problems for which low-income Americans will receive insufficient legal help (“underserved”) or no legal help (“unserved”) requires making some assumptions. Because the extent of legal assistance provided for the problems currently categorized as “served, but extent pending” is not known, we cannot provide a simple estimate for the percent of eligible problems that receive insufficient or no legal assistance. However,
by making some assumptions about the extent to which these problems will be served, we can arrive at a range of estimates. We find that between 62% and 72% of all eligible problems brought to LSC grantees either receive no legal assistance or receive a level of assistance that is not expected to fully address the client’s legal needs. That corresponds to an estimated 1.1 to 1.2 million eligible civil legal problems expected to go unserved or underserved in 2017 alone.
The 62% figure underestimates the problems unserved or underserved. It treats “served, but extent pending” problems as being “served fully.” Conversely, the 72% figure is an overestimation, treating “served, but extent pending” problems as “served, but not fully.” In reality, the rate will fall somewhere in between. See Table 1 above.
A lack of available resources accounts for the vast majority of eligible civil legal problems that go unserved or underserved.
Civil legal problems that are unserved or underserved due to limited resources account for the vast majority of the problems that do not receive the assistance necessary to fully address the client’s needs. Table 2 presents two estimates of the number of eligible problems that go unserved or underserved for this reason. Overall, we estimate that insufficient resources account for between 85% and 97% of all unserved or underserved eligible problems, representing 53% to 70% of all eligible problems. This corresponds to an estimated range of about 900,000 to 1.2 million problems for which the assistance necessary to meet the legal needs of low-income Americans cannot be provided due to a lack of resources. See Table 2.
The upper-bound estimate of 97% is likely an overestimation. Only problems that involve a conflict of interest between parties are not included, corresponding to 3% of unserved or underserved problems. In this case, we assume the worst-case scenario and count all of the “served, but extent pending” problems as served but not to the full extent necessary and attribute this to a lack of resources.
![Table 2: Estimates of eligible problems that are unserved or under severed due to a lack of resources [matrix]](/sites/default/files/images/pg_45.png "Table 2")
Additionally, this 97% estimate treats eligible problems that go unserved due to “other reasons” as unserved due to a lack of resources, because many of the underlying reasons could potentially be resolved or avoided if there were more resources. For example, these reasons often involve situations where legal aid staff lose touch with clients. If there were more resources to facilitate follow-up by legal aid staff or to help clients with transportation to and from meetings, for example, many of these problems would receive the legal assistance needed. To create a simple upper-bound estimate, we assume all of these problems would have received the necessary legal assistance had more resources been available.
The lower-bound estimate of 85% is likely an underestimation. In this case, we assume that all of the “served, but extent pending” problems will be served to the full extent necessary and that none of the problems that are unserved for “other reasons” could have been successfully served had more resources been available. See Appendix B4 for a detailed explanation of how these estimates were calculated.
In 2017, an estimated 1 million civil legal problems brought to LSC grantees by low-income Americans will not receive the legal assistance required to fully address their needs due to a lack of available resources.
Special Focus
This section presents key findings for the six groups of low-income Americans highlighted throughout this report. These groups include seniors, persons with disabilities, veterans, parents and guardians of children under 18, rural residents, and survivors of domestic violence or sexual assault.
Seniors
Key findings related to the civil legal needs and experiences of low-income seniors include the following:
• Approximately 6.4 million seniors have family incomes below 125% of FPL.a
• 56% of low-income seniors’ households experienced a civil legal problem in the past year, including 10% that have experienced 6+ problems.b
• LSC-funded legal aid organizations provided legal services to low-income Americans aged 60+ years old for about 135,000 cases in 2016.c
• The most common types of civil legal problems for low-income seniors’ households include: health (33%), consumer and finance (23%), income maintenance (13%), and wills and estates (12%).b
• Low-income seniors seek professional legal help for 19% of their civil legal problems, receiving inadequate or no professional legal help for an estimated 87% of all their problems.b
• The top reasons low-income seniors give for not seeking legal help include the following:
• Not knowing where to look or what resources were available (22%)
• Deciding to deal with problem on their own (21%)
• Not having time (19%)
• Wasn’t sure if it was a legal issue (17%)
Low-income seniors received inadequate or no professional legal help for 87% of their civil legal problems in 2017.
Client story
Helen | Pennsylvania | Income Maintenance | Helen is a 68-year-old widow whose only income is a monthly Social Security Administration (SSA) widow’s benefit. When she sought help from an LSC grantee, she was scared, vulnerable and overwhelmed. She had just received a letter from the SSA indicating they had overpaid her $47,000 and notifying her that they would stop her monthly benefit payment until the debt was repaid. The legal aid attorney found that the overpayment was caused by fraudulent conduct by Helen’s late ex-husband that occurred after their divorce and long after they had separated. The attorney helped Helen resolve the situation, and she continued to receive her SSA widow’s benefit.
aU.S. Bureau of the Census, American Community Survey, 2015 1-year estimates, S1703: Selected Characteristics Of People At Specified Levels Of Poverty In The Past 12 Months. Senior is defined as ages 65+. b2017 Justice Gap Measurement Survey. c2016 Legal Services Corporation Grantee Activity Report.
Rural Residents
Key findings related to the civil legal needs and experiences of low-income, rural residents include the following:
• Approximately 10 million rural residents have family incomes below 125% of FPL.a
• 75% of low-income rural households experienced a civil legal problem in the past year, including 23% that have experienced 6+ problems.b
• The most common types of civil legal problems among low-income, rural households include: health (43%), consumer and finance (40%), and employment (25%).b
• Low-income rural residents seek professional legal help for 22% of their civil legal problems, receiving inadequate or no professional legal help for an estimated 86% of all their problems.b
• The top reasons low-income, rural residents give for not seeking legal help include the following:b
• Deciding to deal with problem on their own (26%)
• Wasn’t sure if it was a legal issue (21%)
• Not knowing where to look or what resources were available (18%)
Low-income rural residents received inadequate or no professional legal help for 86% of their civil legal problems in 2017.
Client story
Charles | California | Housing | Charles and his wife care for their elderly parents and grandchildren in their home in rural California. They first experienced financial problems when Charles’s employer reduced his work hours. Then he became ill from a life-threatening disease. He and his wife asked their lending bank for help. When the bank did not respond to their modification request, they sought help from an LSC grantee. The legal aid staff succeeded in obtaining a modification that lowered their monthly mortgage payment and established a fixed payment for principal and interest.
aU.S. Bureau of the Census, American Community Survey, 2015 1-year estimates, S1703: Selected Characteristics Of People At Specified Levels Of Poverty In The Past 12 Months. Senior is defined as ages 65+. b 2017 Justice Gap Measurement Survey.
Veterans
Key findings related to the civil legal needs and experiences of low-income veterans and other military personnel include the following:
• More than 1.7 million veterans have family incomes below 125% of FPL.a
• 71% of low-income households with veterans or other military personnel experienced a civil legal problem in the past year, including 21% that have experienced 6+ problems.b
• LSC-funded legal aid organizations provided legal services to low-income households with veterans for about 41,000 cases in 2016.c
• The most common types of civil legal problems for low-income households with veterans and other military personnel include: health (38%), consumer and finance (36%), and employment (20%).b
• Low-income veterans and other military personnel seek professional legal help for 21% of their civil legal problems, receiving inadequate or no professional legal help for an estimated 88% of all their problems.b
• The top reasons low-income veterans and other military personnel give for not seeking legal help include the following:b
• Not knowing where to look or what resources were available (29%)
• Deciding to deal with problem on their own (25%)
• Wasn’t sure if it was a legal issue (18%)
Low-income veterans and other military personnel received inadequate or no professional legal help for 88% of their civil legal problems in 2017.
Client story
Bud | West Virginia | Veteran Benefits | Bud is a 68 year-old Vietnam veteran who had been receiving his Marine pension benefits for the past eight years. After a government clerk keyed in the wrong social security number, his benefits were suspended. Moreover, the Department of Veterans Affairs (VA) deemed the money he had been receiving as overpayment and threatened action against him. Bud tried to correct his record, but he was having a difficult time and, meanwhile, his savings were being depleted. An attorney with an LSC grantee’s Veteran’s Assistance Program worked with the Social Security office, the VA, and the Internal Revenue Service, and was eventually able to establish Bud’s identity, win reinstatement of his pension, and resolve the false overpayment issue.
aU.S. Bureau of the Census, American Community Survey, 2015 1-year estimates, S1703: Selected Characteristics Of People At Specified Levels Of Poverty In The Past 12 Months. Senior is defined as ages 65+. b2017 Justice Gap Measurement Survey. c2016 Legal Services Corporation Grantee Activity Report.
Persons with Disabilities
Key findings related to the civil legal needs and experiences of low-income persons with disabilities include the following:
• More than 11.1 million people with a disability have family incomes below 125% of FPL.a
• 80% of low-income households with someone with a disability experienced a civil legal problem in the past year, including 32% that have experienced 6+ problems.b
• The most common types of civil legal problems among low-income households with someone with a disability include: health (51%), consumer and finance (44%), income maintenance (28%), and disability (23%).b
• Low-income persons with a disability seek professional legal help for 20% of their civil legal problems, receiving inadequate or no professional legal help for an estimated 87% of all their problems.b
• The top reasons low-income persons with a disability give for not seeking legal help include the following:b
• Deciding to deal with problem on their own (25%)
• Not knowing where to look or what resources were available (21%)
• Wasn’t sure if it was a legal issue (19%)
Low-income persons with a disability received inadequate or no professional legal help for 87% of their civil legal problems in 2017.
Client story
Elinor | New York | Housing | Elinor has a daughter with a disability who had to crawl four flights of stairs each day to their apartment. Her daughter spent about 30 minutes sliding down the steps to reach the wheelchair stashed under the stairwell alcove and more than an hour getting in and out of her building to attend school five days a week. When there was a vacancy on the ground floor, Elinor sought to move there, but the landlord told them “transfers” weren’t allowed. Represented by an LSC grantee lawyer, the family was able to acquire the apartment on the ground floor and maintain their $700 rent for their three-bedroom, rent-controlled apartment.
aU.S. Bureau of the Census, American Community Survey, 2015 1-year estimates, S1703: Selected Characteristics Of People At Specified Levels Of Poverty In The Past 12 Months. b2017 Justice Gap Measurement Survey.
Parents of Children under 18
Key findings related to the civil legal needs and experiences of low-income parents and guardians of minor children include the following:
• Approximately 18 million families with related children under 18 have incomes below 125% of FPL.a
• 80% of low-income households with parents or guardians of minor children experienced a civil legal problem in the past year, including 35% that have experienced 6+ problems.b
• Common types of civil legal problems among low-income households with parents or guardians of minor children include: health (46%), consumer and finance (45%), income maintenance (28%), children and custody (27%), family (26%), employment (26%), and education (25%).b
• Low-income parents and guardians of minor children seek professional legal help for 21% of their civil legal problems, receiving inadequate or no professional legal help for an estimated 87% of all their problems.b
• The top reasons low-income parents and guardians of minor children give for not seeking legal help include the following:b
• Deciding to deal with problem on their own (25%)
• Not knowing where to look or what resources were available (21%)
• Wasn’t sure if it was a legal issue (20%)
Low-income parents and guardians of minor children received inadequate or no professional legal help for 87% of their civil legal problems in 2017.
Client story
Patricia | Georgia | Education | Patricia was worried about her 13-year-old daughter, a middle-schooler diagnosed with leukemia. She was being bullied at school and, because she was often ill or hospitalized, she needed help with academics and extra time to complete assignments. After speaking with school officials, Patricia did not feel her concerns were being heard. LSC grantee lawyers worked with the school to develop a special education plan, bringing in an education specialist from the hospital where her daughter was being treated. An individual education plan (IEP) was developed, giving Patricia’s daughter the extra support she needed and permission to wear a hat to cover her bald head. School officials also addressed the bullying, making her time in school safer and more productive.
aCPS Table Creator, Current Population Survey Annual Social and Economic Supplement, US Census Bureau, 2016. https://www.census.gov/cps/data/cpstablecreator.html. b2017 Justice Gap Measurement Survey.
Survivors of Domestic Violence or Sexual Assault
Key findings related to the civil legal needs and experiences of low-income survivors of domestic violence or sexual assault include the following:
• Rates of intimate partner violence among people with family incomes at or below 100% of FPL are about four times higher than the rates among people with incomes at or above 400% of FPL.a
• 97% of low-income households with survivors of recent domestic violence or sexual assault (DV/SA) experienced a civil legal problem in the past year (in addition to problems related to DV/SA), including 67% that have experienced 6+ problems.b
• Common types of civil legal problems among low-income households with recent survivors include: consumer and finance (66%), health (62%), employment (46%), rental housing (45%), income maintenance (44%), and family (40%) (in addition to DV/SA-related problems).b
• Low-income survivors seek professional legal help for 23% of their civil legal problems, receiving inadequate or no professional legal help for an estimated 86% of all their problems.b
• The top reasons low-income survivors give for not seeking legal help include the following:b
• Wasn’t sure if it was a legal issue (31%)
• Not knowing where to look or what resources were available (23%)
• Deciding to deal with problem on their own (20%)
Low-income survivors of recent domestic violence or sexual assault received inadequate or no professional legal help for 86% of their civil legal problems in 2017.
Client story
Frida | Washington | Domestic Violence | Frida, a domestic violence survivor, and her four children, fled abuse at the hands of her husband. The children were sexually molested by their father, confined to the house, and repeatedly threatened with weapons. During the subsequent divorce, the husband was granted unsupervised telephone contact with the children. When one child became suicidal, a legal aid attorney helped Frida secure an order to stop the phone calls. The grantee was able to secure a lifetime protection order and child support. Frida has since started her own business, and her children are doing well in therapy.
aErika Harrell, Ph.D., and Lynn Langton, Ph.D., BJS Statisticians, Marcus Berzofsky, Dr.P.H., Lance Couzens, and Hope Smiley-McDonald, Ph.D., RTI International, Household Poverty and Nonfatal Violent Victimization, 2008–2012, Table 2, Rate of violent victimization, by victim–offender relationship and poverty level, 2008–2012, b2017 Justice Gap Measurement Survey.
Endnotes
1 This is how the Legal Services Corporation (LSC) defines the justice gap and is consistent with the way others in the literature on the topic use the term.
2 New York State Courts Access to Justice Program, “Report to the Chief Judge and the Chief Administrative Judge of the State of New York,” 2015. www.nycourts.gov/ip/nya2j/pdfs/NYA2J_2015report.pdf.
3 James J. Sandman, “Rethinking Access to Justice”, Hawaii Access to Justice Conference, June 20, 2014. http://www.lsc.gov/rethinking-access-justice-james-j-sandman-hawaii-access-justice-conference.
4 Legal Services Corporation, Documenting the Justice Gap In America: The Current Unmet Civil Legal Needs of Low-Income Americans. September 2005 (Updated June 2007 and September 2009). http://www.lsc. gov/sites/default/ les/LSC/images/justicegap.pdf; and http://www.lsc.gov/sites/default/ les/LSC/pdfs/ documenting_the_justice_gap_in_america_2009.pdf.
5 American Bar Association. 1994. Legal Needs and Civil Justice: A Survey of Americans, Major Findings from the Comprehensive Legal Needs Study. http://www.americanbar.org/content/dam/aba/administrative/ legal_aid_indigent_defendants/downloads/legalneedstudy.authcheckdam.pdf.
6 See, for example: Documenting the Justice Gap in Michigan, State Bar of Michigan in Collaboration with Michigan’s Legal Services Corporation Funded Providers, Spring 2012 (Updated Spring 2015). http://www. michbar.org/ le/programs/atj/pdfs/JusticeGap.pdf;
Florida Commission on Access to Civil Justice Interim Report, October 1, 2015. http://devlamp2. abar.org/ wordpress/ accesstojustice/wp-content/uploads/sites/3/2015/10/CivilLegalNeedsstudy_October2015_ V21_Final10_14_15.pdf.
7 Washington State Supreme Court’s Civil Legal Needs Study Update Committee. 2015. 2015 Washington State Civil Legal Needs Study Update. http://ocla.wa.gov/wp-content/uploads/2015/10/ CivilLegalNeedsStudy_October2015_V21_Final10_14_15.pdf.
8 Unfortunately, given the nature of the data analyzed in Section 4, it was not possible to present findings specific to these groups in that section.
9 These figures include only problems for which LSC funds may be used to help an individual based on the person’s income and the type of problem they are facing. LSC eligibility is discussed in further detail in Section 4.
10 See 45 CFR part 1611.3 (October 2015 Edition): https://www.gpo.gov/fdsys/pkg/CFR-2015-title45-vol4/ pdf/CFR-2015-title45-vol4-subtitleB-chapXVI.pdf. In limited circumstances, an LSC grantee can provide legal assistance to individual up to an income of 200% of the federal poverty level: 45 CFR Part 1611.5.
11 See Appendix B1 for details on the data used and estimates made.
12 U.S. Federal Poverty Guidelines used to Determine Financial Eligibility for Certain Federal Programs, Office
of the Assistant Secretary for Planning and Evaluation, U.S. Department of Health and Human Services, January 2017. https://aspe.hhs.gov/poverty-guidelines. Note that these guidelines are estimated by household size for households in the 48 contiguous states, with higher guidelines issued for households in Hawaii and Alaska, where Americans face higher prices on average for basic household necessities.
13 U.S. Bureau of the Census, American Community Survey, 2015 1-year estimates, Table S1701, Poverty Status in the Past 12 Months. The base for this estimate is the entire population for whom poverty status is determined.
14 U.S. Bureau of the Census, American Community Survey, 2015 1-year estimates, S1703: Selected Characteristics Of People At Specified Levels Of Poverty In The Past 12 Months. The base for this estimate is the entire population for whom poverty status is determined.
15 U.S. Bureau of the Census, American Community Survey, 2015 1-year estimates, S1703: Selected Characteristics Of People At Specified Levels Of Poverty In The Past 12 Months. The base for this estimate is the total number of people for whom poverty status is determined in the state.
16 This map is based on the map presented in the Legal Services Corporation FY2018 Budget Request, available at http://www.lsc.gov/media-center/publications/ scal-year-2018-budget-request. The data are from the U.S. Census Bureau, 2015 American Community Survey 1-year estimates, Table S1701, Poverty Status in the Past 12 Months.
17 U.S. Bureau of the Census, American Community Survey, 2015 1-year estimates, S1703: Selected Characteristics Of People At Specified Levels Of Poverty In The Past 12 Months. The base for this estimate is the total number of people for whom poverty status is determined in the U.S who are age 25+.
18 Charn, Jeanne. “Celebrating the ‘Null’ Finding: Evidence-Based Strategies for Improving Access to Legal Services,” 122 The Yale Law Journal, 2206-2234 (2013).
19 U.S. Bureau of the Census, American Community Survey, 2015 1-year estimates, S1703: Selected Characteristics Of People At Specified Levels Of Poverty In The Past 12 Months. The base for this estimate is the estimated number of people below 125% FPL.
20 Greene, Sara Sternberg. “Race, Class, and Access to Civil Justice,” 101 Iowa Law Review 1234-1322 (2016).
21 U.S. Bureau of the Census, American Community Survey, 2015 1-year estimates, S1703: Selected Characteristics Of People At Specified Levels Of Poverty In The Past 12 Months. Senior is defined as ages 65+.
22 American Community Survey Single Year Estimates, 2015. Table C17024: Age by Ratio of Income to Poverty Level in the Past 12 Months. Geography: United States – Rural. The ACS defines rural as ‘Territory, population and housing units not classified as urban. ‘Rural’ classification cuts across other hierarchies and can be in metropolitan or non-metropolitan areas.” See https://factfinder.census.gov/help/en/index.htm#rural.htm.
23 Calculated from U.S. Bureau of the Census, American Community Survey 2015 1-Year Estimates, Table S1701: Poverty Status In The Past 12 Months and Table S2101: Veteran Status. To compute this estimate, the ratio of the estimated number of persons with incomes less than 125% of FPL to Persons with incomes less than 100% FPL was applied to the total number of veterans below 100% FPL to estimate the number of veterans below 125% FPL.
24 U.S. Bureau of the Census, American Community Survey, 2015 1-year estimates, S1703: Selected Characteristics Of People At Specified Levels Of Poverty In The Past 12 Months.
25 CPS Table Creator, Current Population Survey Annual Social and Economic Supplement, US Census Bureau, 2016. https://www.census.gov/cps/data/cpstablecreator.html.
26 Erika Harrell, Ph.D., and Lynn Langton, Ph.D., BJS Statisticians, Marcus Berzofsky, Dr.P.H., Lance Couzens, and Hope Smiley-McDonald, Ph.D., RTI International, Household Poverty and Nonfatal Violent Victimization, 2008–2012, Table 2, Rate of violent victimization, by victim–offender relationship and poverty level, 2008– 2012, see https://www.bjs.gov/content/pub/pdf/hpnvv0812.pdf.
27 2017 Justice Gap Measurement Survey, 2017, computed variables indicating whether households and individuals experienced at least one civil legal problem in each category in the past 12 months, based on several questionnaire items.
28 Base sizes vary and can be referenced in the supporting Justice Gap Appendix B2 Tables at www.lsc.gov/ justicegap2017.
29 Rebecca L. Sandefur, “Accessing Justice in the Contemporary United States. Findings from the Community Needs and Services Study,” American Bar Foundation and University of Illinois at Urbana-Champaign, August 2014; Megan Sandel, Mark Hansen, Robert Kahn, Ellen Lawton, Edward Paul, Victoria Parker, Samantha Morton, and Barry Zuckerman, “Medical-Legal Partnerships: Transforming Primary Care by Addressing the Legal Needs of Needs of Vulnerable Populations,” 29 Health Affairs 9, 1697-1705.
30 2017 Justice Gap Measurement Survey, 2017, computed variable indicating the severity of each civil legal problem that was personally experienced, based on responses to questionnaire items asking: How much did the following issue(s) personally affect you? Response options: not at all, slightly, moderately, very much, and severely.
SB-1Note small base size of n=56 for personally experienced problems relating to veterans’ issues; this statistic has a large standard error. See Justice Gap Appendix B2 Tables at www.lsc.gov/justicegap2017.
SB-2Note small base size of n=84 for personally experienced problems relating to homeownership; this statistic has a large standard error. See Justice Gap Appendix B2
31 At certain points in the survey, some respondents were able to indicate that they had sought help but did not receive it. Unfortunately, not all respondents who sought help had the opportunity to explicitly indicate this so it is not possible to give an estimate of how often this occurs.
32 This figure includes problems for which respondents indicated (1) they sought no help of any kind, (2) they sought some sort of assistance from others and/or information online, but they did not seek the help of a legal professional, (3) they sought help from a legal professional, but were unable to get it, or (4) they sought and received help from a legal professional, but felt that they did not or would not be able to get as much legal help with the issue as they felt they needed.
SB-3Note small base size of n=69 for problems relating to wills and estates; this statistic has a large standard error. See Justice Gap Appendix B3 Tables at www.lsc.gov/justicegap2017.
33 2017 Justice Gap Measurement Survey, 2017, computed variable summarizing legal help-seeking behavior for civil legal issues, based on multiple questionnaire responses.
SB-4Note small base size of n=32 for problems relating to veterans’ issues; this statistic has a large standard error. See Justice Gap Appendix B3 Tables at www.lsc.gov/justicegap2017.
SB-5Note small base size of n=45 for problems relating to issues of homeownership; this statistic has a large standard error. See Justice Gap Appendix B3 Tables at www.lsc.gov/justicegap2017.
34 2017 Justice Gap Measurement Survey, question 30: What kind of legal help [have you received so far / did you receive]? (multiple response).
35 Due to limited survey data on online searches for legal information, we cannot present detailed findings on this topic.
36 Sarah Sternberg Greene, “Race, Class, and Access to Civil Justice,” 101 Iowa Law Review, 1263-1321 (2016); Rebecca L. Sandefur, “Accessing Justice in the Contemporary United States. Findings from the Community Needs and Services Study,” American Bar Foundation and University of Illinois at Urbana-Champaign, August 2014.
37 Rebecca L. Sandefur, “Bridging the Gap. Rethinking Outreach for Greater Access to Justice,” University of Arkansas at Little Rock Law Review 4, 721-740, 2015.
38 2017 Justice Gap Measurement Survey, questions 35 and 37: Why [haven’t you talked / didn’t you talk] to a legal professional for this issue? Why [haven’t you talked / didn’t you] talk to anyone else for help or looked for information online about this issue? (multiple response).
39 2017 Justice Gap Measurement Survey, questions 41, 42, and 43: To what extent do you think people like you have the ability to use the courts to protect yourself and your family or enforce your rights?, To what extent do you think people like you are treated fairly in the civil legal system?, To what extent do you think the civil legal system can help people like you solve important problems such as those you identified in this survey?
40 We present the total number of problems examined in this section of the survey for each group listed. Please see the Justice Gap Appendix B3 Tables at www.lsc.gov/justicegap2017 for the number of corresponding respondents as well as other supporting statistical information on these findings.
41 See Appendix B4 for more information about LSC’s 2017 Intake Census and the resulting data analysis.
42 The Intake Census tracked the number of individuals, not the number of problems, but it is fair to assume
that the number of individuals approaching LSC grantees is very close to the number of problems presented to them in this six-week period of time. It is possible that an individual had more than one problem, but this is not likely a common occurrence given the short span of time. For the remainder of this section, we assume that the number of individuals and the number of problems tracked during the Intake Census are equivalent, referring to the number of problems for the purposes of analysis. Our estimates are therefore conservative: to the extent individuals and problems are not equivalent, we are underestimating the number of legal problems for which low-income Americans will seek help from LSC grantees in 2017.
43 For more information on the rules governing the use of LSC funds, see: http://www.lsc.gov/lsc-restrictions- and-funding-sources.
44 Case services incorporate eligible problems for which LSC grantees provide legal advice and/or representation. Case services do not include problems for which LSC grantees provide pro se assistance if only legal information or referrals to resources is provided. Case services correspond with “cases closed” and “cases open” in the Grant Activity Reports submitted to LSC.
45 Grant Activity Reports, Calendar Years 2014-2016, Legal Service Corporation. Note that the proportions calculated are based on both open and closed cases in a given calendar year.
46 Note that the distribution of case services presented for 2016 is consistent with for other recent years, including 2013, 2014, and 2015.
47 2017 LSC Intake Census. Note, LSC grantees also regularly engage in outreach intake. The numbers for this are not represented in Figure 9.
48 LSC 2017 Intake Census. See Appendix B4 for details on calculations.
49 The problems coded as fully served with “limited services” include cases that are expected to be fully
resolved with the legal assistance provided and have been closed with the following LSC Case Service Report (CSR) Closure categories: A “Counsel and Advice”, B “Limited Action”, and L “Extensive Service (not resulting in settlement or court or administrative action). See the LSC 2017 Case Service Report (CSR) Handbook for more information on these definitions: http://www.lsc.gov/csr-handbook-2017.
50 The problems coded as fully served with “extended services” include cases that have been closed with the following LSC Case Service Report (CSR) Closure categories: F “Negotiated Settlement without Litigation”, G “Negotiated Settlement with Litigation”, H Administrative Agency Decision, and I “Court Decision.” See LSC 2017 CSR Handbook referenced above for more information: http://www.lsc.gov/csr-handbook-2017.
51 The types of cases counted as receiving more involved assistance like providing legal advice, speaking with third parties on behalf of a client, or help preparing legal documents include cases that have been closed with the following LSC CSR Closure categories AND are expected to be fully resolved with the legal assistance provided: A “Counsel and Advice”, B “Limited Action”, and L “Extensive Service (not resulting in settlement or court or administrative action). See the LSC 2017 Case Service Report (CSR) Handbook for more information on these definitions: http://www.lsc.gov/csr-handbook-2017.
52 LSC 2017 Intake Census. See Appendix B4 for details.
53 LSC 2017 Intake Census. See Appendix B4 for details on calculations.
Appendix A: 2017 Justice Gap Measurement Survey Methodology
Readers are encouraged to visit www.lsc.gov/justicegap2017, where they can find the full technical survey report, the questionnaire, and the codebook corresponding to the 2017 Justice Gap Measurement Survey. In this appendix, we present some important methodological information about the survey, including information about sampling, survey structure, survey administration, statistical weighting, and the demographic pro le of the sample. Additional methodology details can be found in the full technical survey report.
Sampling
For this study, LSC was specifically interested in surveying approximately 2,000 adults living in households with incomes at or below 125% of the federal poverty threshold. Identifying and interviewing a large number of respondents meeting this criterion via many traditional survey methods would be logistically challenging and costly due to the amount of outreach and screening that would be necessary. To efficiently identify individuals residing in such households and interview them in a cost-effective manner, LSC contracted with NORC to conduct the survey using AmeriSpeak®, which is NORC’s probability-based panel designed to be representative of the entire U.S. household population. The AmeriSpeak Panel is designed to provide a nationally representative sample of US households for public opinion research. AmeriSpeak was built using a rigorous sampling and recruitment methodology based on probability sampling techniques employed by federally sponsored research.
There are three principal design elements responsible for the scienti c integrity of AmeriSpeak. First, it is probability-based, meaning that randomly selected households are sampled with a known, non-zero probability of selection from a documented sample frame. (Almost all other commercially available household panels are based on non-probability, convenience sampling.) AmeriSpeak’s sample source is the NORC National Frame, which is an area probability sample designed to provide at least 97% sample coverage of the U.S. population, and allows for increased sample coverage for rural and low-income households. The NORC National Frame is the sample source for landmark NORC surveys such as the General Social Survey and the Survey of Consumer Finance.
Second, AmeriSpeak has the highest American Association for Public Opinion Research (AAPOR) response rate – a key measure of sample quality – among commercially available household panels. The industry- leading response rate for AmeriSpeak is attributable to the extraordinary contact and gaining cooperation techniques used by AmeriSpeak in recruiting randomly sampled US households. The gaining-cooperation techniques rely on traditional methodologies employed in federally sponsored research for decades. Households selected for AmeriSpeak are contacted in English and Spanish, by a series of U.S. mailings and by NORC telephone and eld interviewers. Use of field interviewers for in-person recruitment (i.e., face-to- face interviewing) enhances response rates and representativeness for young adults, lower socio-economic households, and non-internet households.
Third, AmeriSpeak in its design facilitates the representation of US households that are commonly under- represented in online panel research. While many panels conduct surveys via the web only, AmeriSpeak recruits households using a combination of telephone and face-to-face methodologies in order to assure that non-internet, “net averse” households, and persons with low literacy levels are represented in AmeriSpeak. Moreover, after joining AmeriSpeak, panelists have the option to participate in the survey program via web or telephone (speaking with NORC’s professional telephone interviewers). Because AmeriSpeak conducts its surveys in both the telephone and web modes of data collection, AmeriSpeak provides data collections for panelists whether they are comfortable or uncomfortable with web-based surveys.
While NORC keeps recently updated income information on le for all AmeriSpeak panelists, it was important to verify each household’s income level relative to the federal poverty guidelines for this study. NORC drew a sample of roughly 10,500 adults age 18 and older who had previously indicated that their household earnings were at or below 200% of the federal poverty level, with the plan to screen these panelists and select only those with current household incomes at or below 125% of the federal poverty threshold as eligible to complete the survey. The 2016 federal poverty guidelines set by the U.S. Department of Health and Human Services were used to determine income thresholds for screening households of various sizes.
Survey Structure
The household screening portion of the survey consisted of only two questions, which assessed current household size and income level. Following the screening questions, eligible respondents proceeded to a section containing questions about household characteristics. This was followed by the largest portion of the main survey instrument, which contained questions assessing the prevalence of various types of civil legal needs. LSC and NORC worked to re ne a list of common civil legal issues to include in this portion of the survey, arriving at a final list of 88 distinct issues. These issues were divided into 12 categories.
Some of the categories of civil legal problems were issues that might affect any low-income family, including employment, health, consumer and finance, income maintenance, family and custodial issues, as well as assistance with wills and estates. Other categories of problems only applied to certain subpopulations – survivors of domestic violence, homeowners, renters, households with children, individuals with disabilities, and veterans, so the survey was structured in a way that used earlier answers about household characteristics to selectively present questions related to those characteristics. For example, survey respondents were asked about their living situations, and those who indicated that they owned their homes were presented with a section covering civil legal problems experienced by homeowners, while those who indicated that their homes were rented were presented with a battery of questions about issues with rental housing instead. In addition, only those respondents who indicated that someone in the household was in school (or had children in school) received the section about civil legal issues related to education, while others did not. Finally, sections about disability issues and veterans’ issues were only presented to respondents who indicated that at least one member of their household had a disability, or were military personnel or veterans, respectively.
Within each section of the survey assessing the prevalence of civil legal problems, respondents were presented with a number of specific issues and asked to indicate for each one whether they personally had experienced the issue and whether someone else in their household had experienced the issue within the last 12 months. Each of these questions allowed for multiple selections, so it was possible for respondents to indicate that the issue had been experienced both by themselves and by others. There was also an option to indicate that no one in the household had experienced the problem in the last 12 months.
To delve further into the problems affecting individual respondents, the survey dynamically presented questions about problem severity at the conclusion of each battery of problems. For each issue that respondents indicated they had personally experienced within the last 12 months, they were asked to rate the effect the problem had on them on a five-point scale from “not at all” to “severe.”
Following the problem prevalence and severity sections, respondents who had reported that they were personally affected by at least one civil legal issue were presented with a section related to help-seeking behaviors. The first item in this section was a multi-part question covering each relevant civil legal problem and asking respondents to indicate whether they had talked to someone about the problem, had looked for information online, both talked to someone and gone online, or not engaged in either of these behaviors. This question covered all personally experienced problems, except for those that were rated as affecting respondents “not at all”.
Next, the survey included detailed questions about help-seeking behaviors for a subset of the problems reported. As to not overburden respondents who had reported a large number of issues, the survey randomly selected a maximum of four problems for follow-up questions. Each respondent looped through this section up to four times, depending on the number of issues he or she had reported earlier in the survey. The detailed questions included items about the current state of each problem, who (if anyone) the respondent had talked to about the problem (including legal professionals), the type of information sought online (if any), the type of legal assistance received (if any), and reasons why help was not sought (if appropriate). The final section of the survey included three questions assessing perceptions about the fairness and efficacy of the civil legal system.
Survey Administration
A total of 2,028 respondents completed the survey between the dates of January 5, and February 10, 2017, including 1,736 who completed via the web and 292 who completed via telephone. Interviews were completed in both English and Spanish, depending on respondent preference. The screener completion rate for this study was 38.5%. The incidence or eligibility rate was 56.4%. The interview completion rate was 89.1%. The final response rate was 11.2%, based on the American Association for Public Opinion Research Response Rate 3 Method.
Statistical Weighting
Statistical weights for the study-eligible respondents were calculated using panel base sampling weights to start. Panel base sampling weights for all sampled housing units are computed as the inverse of probability of selection from the NORC National Sample Frame (the frame used to sample housing units for AmeriSpeak) or address-based sample. The sample design and recruitment protocol for the AmeriSpeak Panel involves subsampling of initial non-respondent housing units. These subsampled non-respondent housing units are selected for an in-person follow up. The subsample of housing units that are selected for the nonresponse follow up have their panel base sampling weights inflated by the inverse of the subsampling rate. The base sampling weights are further adjusted to account for unknown eligibility and nonresponse among eligible housing units. The household-level nonresponse adjusted weights are then post-stratified to external counts for number of households obtained from the Current Population Survey. Then, these household-level post- stratified weights are assigned to each eligible adult in every recruited household. Furthermore, a person-level nonresponse adjustment accounts for nonresponding adults within a recruited household.
Finally, panel weights are raked to external population totals associated with age, sex, education, race/ethnicity, housing tenure, telephone status, and Census division. The external population totals are obtained from the Current Population Survey.
Study-specific base sampling weights are derived using a combination of the final panel weight and the probability of selection associated with the sampled panel member. Since not all sampled panel members respond to the screener interview, an adjustment is needed to account for and adjust for screener non- respondents. This adjustment decreases potential nonresponse bias associated with sampled panel members who did not complete the screener interview for the study.
Furthermore, among eligible sampled panel members (as identified via the survey screener questions), not all complete the survey interview for the study. Thus, the screener nonresponse adjusted weights for the study are adjusted via a raking ratio method to 125% of the federal poverty line population totals associated with the following socio-demographic characteristics: age, sex, education, race/ethnicity, and Census division.
Population totals for the 125% of the federal poverty line sample for the Justice Gap Study were obtained using the screener nonresponse adjusted weight for all eligible respondents from the screener question(s). At the final stage of weighting, any extreme weights were trimmed based on a criterion of minimizing the mean squared error associated with key survey estimates, and then, weights re-raked to the same population totals. The overall margin of sampling error was +/- 3.27 percentage points for a 50% statistic, adjusted for design effect resulting from the complex sample design.
A more detailed description of AmeriSpeak panel recruitment and management methodology, and additional information about the Justice Gap Study methodology, are included in Appendices A and B, respectively.
Sample Demographic Profile
The respondents who completed the survey represent households in the United States with incomes at or below 125% of the federal poverty level, based on the 2016 federal poverty guidelines set by the Department of Health and Human Services. These households include a range of incomes depending on household size, from $14,850 for a single person household to $61,520 for households of 10 or more. For a family of four, the threshold was $30,380. About a quarter (24%) of this group have annual household incomes of $9,999 or less, while 19% have incomes between $10,000 and $14,999, 31% have incomes between $15,000 and $24,999, and 26% have incomes of $25,000 or more.
Roughly one third (34%) of this group are under the age of 35, and the remainder are evenly split between the age groups of 35 to 49 (23%), 50 to 64 (22%), and 65 and older (21%). There are more women than men in low-income households (58% vs. 42%). In terms of racial and ethnic identification, just under half (46%) are white, a quarter are Hispanic, 21% are African-American, and 8% fall into some other category or identify as multi-racial. Eighty-five percent live within a metropolitan area, while 15% live outside of metropolitan areas. Most have at least a high school education, but few have a college degree. Twenty-eight percent have not finished high school, while 35% have a high school diploma or equivalent, 29% have completed some college, 6% have a bachelor’s degree, and 2% have a graduate degree. Over a third (35%) are currently employed, but nearly two-thirds (65%) are not working, including 17% who are retired, 13% who are looking for work, and 21% who are not working due to disabilities.
Over a third (34%) reported that the home they live in is owned, and roughly the same number (36%) said they live in a rented home without public assistance, while 17% live in a home that is rented with public assistance, and 13% report having some other housing arrangement. Roughly a quarter are married, and three-quarters are not. Nearly 3 in 10 (28%) live alone, and about half live in households with at least two other members. Four in 10 of these households include parents of children or teenagers under the age of 18 in their households. Six in 10 have internet access at home, at work, or at some other location, while the remaining 4 in 10 only have internet access on a mobile phone or have no access at all.
Appendix B1: Section 1 Data Sources and Methodology
Most of the descriptive data on the population below 125% FPL come from the American Community Survey (ACS) 2015 Single Year Estimates. Most figures are based on data from table S1703: Selected Characteristics of People at Specified Levels of Poverty in the Past 12 Months. At times additional tables were used to provide estimates and are noted in endnotes. To estimate the number of Americans under 125% FPL for each of the groups presented in the report, we used the percent of the population that is estimated to be under 125% FPL and the total number of people estimated to comprise each group. Figures for the estimated number of veterans under 125% FPL are not readily available and had to be calculated. We estimated this figure by calculating ratio of the number of people below 100% FPL and the number of people below 125% FPL nationwide. We applied this ratio to the total number of veterans living below 100% FPL in order to estimate the total number of veterans living below 125% FPL nationwide.
Appendix Table B1.1:
Percent of state populations below 125% of the Federal Poverty Level (FPL).
Data Source: United States Census Bureau, American Community Survey 2015 1-year Estimates, Table S1703: Selected Characteristics of People at Specified Levels of Poverty in the Past 12 Months, accessed June 6, 2017.


Appendix B2: Section 2 Data Sources and Methodology
The findings presented in Section 2, “Experience with Civil Legal Problems,” come exclusively from the 2017 Justice Gap Measurement Survey. Respondents were presented with an extensive list of specific problems that usually raise civil legal issues. They were asked whether they had experienced any of these problems in the past 12 months and whether anyone else in their household had experienced any of them.
Readers are encouraged to visit www.lsc.gov/justicegap2017, where they can find a document that supplements this appendix called, “Justice Gap Appendix B2 Tables.” This document presents a number of tables with additional information on the survey results presented in Section 2 of this report. For a given set of survey results, the tables present the calculated proportion (or “percent”) along with the standard error of the percent and the unweighted base for the corresponding variable. On the same landing page (www.lsc.gov/justicegap2017), readers can find the full technical survey report, the questionnaire, and the codebook corresponding to the 2017 Justice Gap Measurement Survey.
Appendix B3: Section 3 Data Sources and Methodology
The findings presented in Section 3, “Seeking Legal Help,” come exclusively from the 2017 Justice Gap Measurement Survey. More specifically, this section presents findings from a part of the survey that asked detailed questions about a subset of the civil legal problems reported by respondents. For each respondent, the survey randomly selected up to four personally-experienced problems affecting them more than “not at all.” Due to the low incidence of problems relating to veterans’ issues and disabilities, these problems were always selected if they met the other criteria. Respondents answered questions about what, if any, help they sought to address each of these problems. The primary unit of analysis in this section is problems.
Readers are encouraged to visit www.lsc.gov/justicegap2017, where they can find a document that supplements this appendix called, “Justice Gap Appendix B3 Tables.” This document provides additional information on the survey results presented in Section 3 of this report. For a given set of survey results, the table presents the calculated proportion (or “percent”) along with the standard error of the percent and the unweighted base for the corresponding variable. Because the primary unit of analysis in this section is problems, the bases represent a number of problems (with the exception of Appendix Table B3.6, where individuals are the unit of analysis). For reference, we have also included the (unweighted) number of respondents corresponding to those problems.
On the same landing page (www.lsc.gov/justicegap2017), readers can find the full technical survey report, the questionnaire, and the codebook corresponding to the 2017 Justice Gap Measurement Survey.
Appendix B4: Section 4 Data Sources and Methodology
Most of the findings presented in Section 4, “Reports from the Field,” are based on data collected during the Legal Services Corporation’s (LSC) 2017 Intake Census. Additional data used in that section come from LSC’s 2016 Grantee Activity Report. This appendix provides more information about both of these data sources as well as details about the assumptions underlying estimates presented in Section 4.
The Legal Services Corporation 2017 Intake Census
Data Collection
As with LSC’s two prior justice gap studies, LSC asked its grantees to conduct an Intake Census by documenting the number of individuals who approached LSC grantees with legal needs that could not be addressed because of insufficient resources. The 2017 Intake Census instrument has more categories than the two previous instruments to yield a more granular analysis of the reasons why an individual may not receive services from a grantee. LSC recognizes that this process is imperfect and will not capture all of the unmet need, which is why LSC pursued the national survey with NORC using the AmeriSpeak Panel in addition to conducting the Intake Census.
From March 6, 2017 to April 14, 2017, LSC grantees tracked and collected data about those individuals who approached their program with a legal problem. The Intake Census Instrument has three main data collection categories: (1) Unable to Serve, (2) Unable to Serve Fully, and (3) Fully Served.
Unable to Serve. An individual may fall into the “Unable to Serve” category for a number reasons, including being financially ineligible for services (with a household income that is too high) or being a non-citizen. Other reasons for placing an individual in this category are that the person’s problem was not the type of legal issue the grantee handles on a regular basis (e.g., commercial transactions) or the grantee has insufficient resources to assist the individual with their problem.
The five subcategories within “Unable to Serve” are:
- Unable to Serve – Ineligible
- Unable to Serve – Conflict of Interest
- Unable to Serve – Outside of Program Priorities or Case Acceptance Guidelines
- Unable to Serve – Insufficient Resources
- Unable to Serve – Other Reasons
Unable to Serve Fully. An individual may be placed in the “Unable to Serve Fully” category if the individual received some form of legal information or legal advice to help address their problem. In this category, the grantee assesses if the case would have been appropriate for full representation if the grantee had sufficient funding. The legal information or legal advice the individual received in not expected to fully resolve the individual’s case.
The two subcategories within “Unable to Serve Fully” are:
- Unable to Serve Fully – Insufficient Resources –Provision of Legal Information or Pro Se Resources
- Unable to Serve Fully – Insufficient Resources – Provided Limited Service or Closing Code “L”
Fully Served. An individual is categorized as “Fully Served” if the grantee has sufficient resources to fully address the individual’s problem at an appropriate level given the facts and nature of the case. The legal assistance provided in these cases can vary from providing brief legal advice, or help filling out a form, to full legal representation in court.
The three subcategories within “Fully Served” are:
- Fully Served –Provision of Legal Information or Pro Se Resources
- Fully Served – Provision of Limited Services or Closing Code L
- Fully Served – Extended Service Case Accepted
Finally, there is an additional category called “Pending,” which includes individuals that will receive legal help of some kind, but for whom program management had not made a final decision on the level of legal assistance they will be able to provide before data collection for the Intake Census had ended. Had data collection continued for a longer period of time, such individuals would most likely have been coded into one of the following subcategories:
- Unable to Serve Fully – Insufficient Resources – Provided Limited Service or Closing Code “L”
- Fully Served – Provision of Limited Services or Closing Code L
- Fully Served – Extended Service Case Accepted
Additional information about the 2017 Intake Census, including the detailed definitions of each of these categories and the data collection instructions given to grantees, can be found at www.lsc.gov/justicegap2017.
A total of 132 LSC grantees (out of 133) submitted 2017 Intake Census data. When submitting their data, grantees were also asked to provide the average number of hours they offer intake to potential clients in various modes (e.g., by phone, online, in-person appointments, walk-in) on a weekly basis. They were also asked to indicate the extent to which the six-week Intake Census period was typical and, where applicable, to elaborate about why intake might have been atypical. Fifteen of the total 132 grantees indicated that this period was atypical for them. Twelve of the 15 who said it was atypical, say they processed fewer people for intake than usual because of holidays, staff shortages, or other reasons.
Data Analysis
Unit of Analysis. It is important to note that while the Intake Census tracked the number of individuals, the analysis in Section 4 uses problems as the unit of analysis. It is fair to assume that the number of individuals approaching LSC grantees is very close to the number of problems presented to them in this six-week period of time. It is possible that an individual had more than one problem, but this is not likely a common occurrence given the short span of time covered during data collection. Throughout Section 4, we assume that the number of individuals and the number of problems tracked during the Intake Census are equivalent, referring to the number of problems for the purposes of analysis. The estimates in this report are therefore conservative: to the extent individuals and problems are not equivalent, we are underestimating the number of legal problems for which low-income Americans will seek help from LSC grantees in 2017.
12-month Projections. Throughout this section, we provide 12-month projection estimates for the total number of problems low-income Americans will present to LSC grantees in 2017 and subsets of those problems. These projections were calculated by multiplying the relevant Intake Census figure by 8.6905 (52.14 weeks divided by 6 weeks) and rounding to the nearest hundred.
Estimating the Number of Problems Unserved and Underserved Due to Lack of Resources. In Section 4, we present a range of estimates for the number of problems presented to LSC grantees that do not receive any legal help (“unserved”) or do not receive enough legal help to fully address the client’s needs (“underserved”). In that section, we describe the assumptions we make to produce these estimates and the reasoning behind them. Here, we lay out these assumptions in terms of the original data collection coding scheme.
To produce the upper-bound estimate, we make the following assumptions:
• All observations coded as “Pending” would eventually be coded as “Unable to Serve Fully” and the reason they would not be “Fully Served” is for reasons related to a lack of resources.
- All observations coded in the following categories were “Unable to Serve” for reasons related to a lack of resources:
- Unable to Serve – Outside of Program Priorities or Case Acceptance Guidelines
- Unable to Serve – Insufficient Resources
- Unable to Serve – Other Reasons
- All observations coded in the following subcategories were “Unable to Serve Fully” for reasons related to a lack of resources:
- Unable to Serve Fully – Insufficient Resources –Provision of Legal Information or Pro Se Resources
- Unable to Serve Fully – Insufficient Resources – Provided Limited Service or Closing Code “L”
To produce the lower-bound estimate, we make the following assumptions:
- All observations coded as “Pending” would eventually be coded as “Served Fully.”
- All observations coded in the following categories were “Unable to Serve” for reasons related to a lack of resources:
- Unable to Serve – Outside of Program Priorities or Case Acceptance Guidelines
- Unable to Serve – Insufficient Resources
- None of the observations coded as “Unable to Serve – Other Reasons” would have been served if more resources were available.
- All observations coded in the following subcategories were “Unable to Serve Fully” for reasons related to a lack of resources:
- Unable to Serve Fully – Insufficient Resources –Provision of Legal Information or Pro Se Resources
- Unable to Serve Fully – Insufficient Resources – Provided Limited Service or Closing Code “L”
Legal Service Corporation Grantee Activity Report
Section 4 presents the distribution of the types of problems for which LSC grantees provided case services in 2016. The data for this come from the Legal Services Corporation Grantee Activity Report (GAR) data. GAR is the largest and longest running data collection effort on civil legal aid in the United States. Dating back to 1976, LSC has recorded and reported data from grantees in a variety of ways. Information from the Grantee Activity Reports is summarized on an annual basis by LSC staff for public reports and for internal use by management and program staff. The data are also publicly available through the Grantee Data Page on the LSC site and as a full dataset at LCS’s DATA.GOV site: https://catalog.data.gov/organization/legal-services-corporation.
The data are gathered annually from all grantees on a calendar year basis. Grantees use automated reporting forms that are accessible via the Internet. Grantees report on the conduct of their Basic Field, Agricultural Worker and Native American grant programs to LSC on a calendar year basis, using automated reporting forms that are accessible via the Internet. The reports are collected in January and February of each year.
More information about the GAR can be found at http://www.lsc.gov/grant-activity-reports.
Board of Directors
John G. Levi
Chairman
Martha Minow
Vice Chair
Robert J. Grey Jr. Harry J.F. Korrell III Victor B. Maddox Laurie Mikva
Fr. Pius Pietrzyk, O.P. Julie A. Reiskin
Gloria Valencia-Weber
Of cers
James J. Sandman
President
Carol A. Bergman
Vice President for Government Relations and Public A airs
Ronald Flagg
General Counsel, Corporate Secretary and Vice President for Legal A airs
Lynn A. Jennings
Vice President for Grants Management
David L. Richardson
Treasurer and Comptroller
For more information
Carl Rauscher, Director of Communications and Media Relations
Legal Services Corporation
3333 K Street NW, Washington, DC 20007 202.295.1615
www.lsc.gov
Follow LSC @
Like us on Facebook at facebook.com/LegalServicesCorporation
Follow us on Twitter at twitter.com/LSCtweets
View us on Vimeo at vimeo.com/user10746153
and on YouTube at youtube.com/user/LegalServicesCorp
Download Files
| Title of File or Publication | Size | Format |